Profiling python with cProfile
A couple of days ago, I had an assignment for an Information Retrieval class that basically involved:
- Indexing a large corpus (Reuters from
nltk) - Searching it using boolean queries (eg.
bill AND gates)
For the second part of the of the assignment, performance was pretty important. Since we would want to return results for the user's queries quickly.
This blogpost is basically about how I used python's cProfile to identify and fix bottlenecks/slow parts in my code. Most of these bottlenecks would have been hard to identify without the profiler.
During my internship at Quora, one of the things I worked on was POST speed improvements for core actions across the product. It was my first brush with speed work and the main lesson I took away was the importance of measuring and profiling before attempting to optimise.
"Bottlenecks occur ins surprising places, so don't try to second guess and put in a speed hack until you have proven that's where the bottleneck is." - Rob Pike
Measure
After getting a working submission out. I proceeded to measure/benchmark my code. Since
this program was meant to run as a script from the command line, I used the
simple time command-line tool to roughly benchmark how fast my code was.
$ time python search.py
# real    0m1.521s
# user    0m1.250s
# sys     0m0.142s
Profile
Once I was happy with the measurement, I proceeded to profile my code using cProfile.
$ python -m cProfile -o profile_output search.py
The -o flag basically specifies an output filename for cProfile to write its
output to. (Without which, it'll simply spit out the stats to the stdout, which
is undesirable since we'd be unable to sort/drill down into specific functions.)
Making sense of the cProfile output
The cProfile output is a basically binary file that contains the following information:
(For each function called in the python program)
- How long each call took (percall, inclusive and exclusive)
- How many times it was called (ncalls)
- How long it took (cumtime: includes the times of other functions it calls)
- How long it actually took (tottime: excludes the times of other functions)
- What functions it called (callers)
- What functions called it (callees)
If you didn't specify the output, you'll basically only get a dump of the
information without the caller/callees part. (Which is quite helpful in making
sense of everything). You'd also lose the ability to dynamically re-sort the
information based on your preferred metric (unless you re-profile it with a -s flag (I think)).
Reading the cProfile binary output file
In order to read this binary file, python provides a pstats.Stats class that happily spits out the various infomation for you in a python shell (when called with the relevant methods).
I found this rather tedious and googling around for an easier way to read this binary file yield nothing. I just wanted a simple way to:
- See all the information
- Sort them with a single click
- Drill down to functions (and their callers and callees) with a single click
(These as oppose to manually calling methods on the Stats object each time.)
So I wrote this: CProfileV. Which is bacially a thin wrapper for viewing python cProfile output in your browser. Yay!
[UPDATE]: cProfileV has been updated. See https://github.com/ymichael/cprofilev for the latest usage instructions.
# Install cprofilev
$ sudo pip install cprofilev

# Call it with your cprofile output
$ cprofilev -f /path/to/cprofile/output

# Navigate to http://localhost:4000
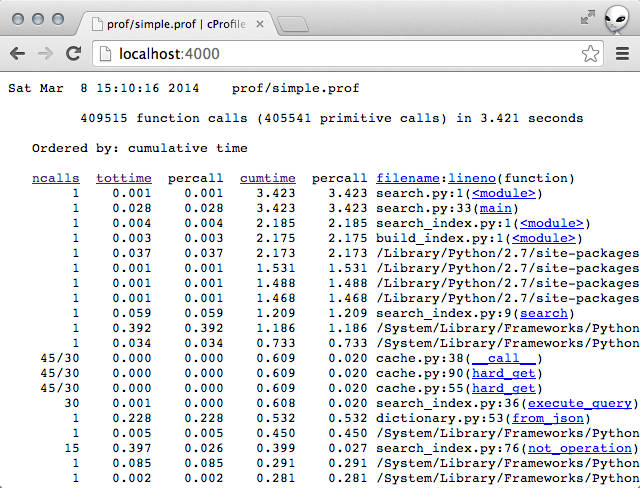
Finding the bottlenecks
The pstats.Stats object allows you to sort by the various keys and their combinations. Most often, I find that the most useful sort keys are:
- cumulative time
- total time
- calls (to find unneccessary function calls (objects being created in a loop for instance))
Sorting by total time for me yielded this:
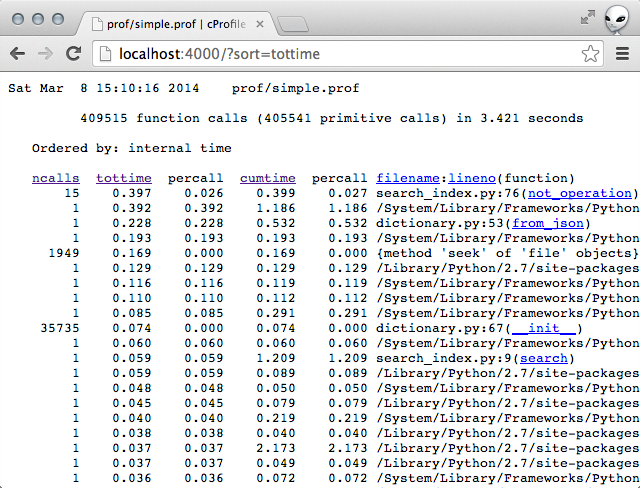
The top line stood out to me. The function not_operation was taking a
suspiciously long time.
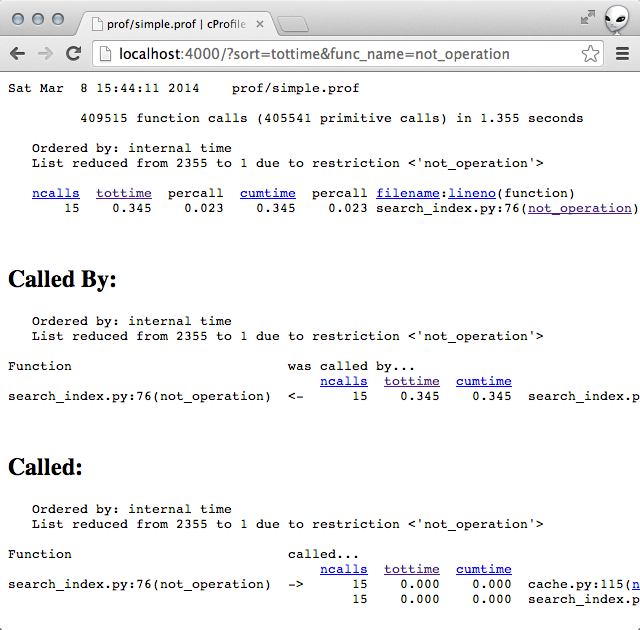
Clicking into the not_operation showed that the functions it was calling were
not taking a lot of time. (Implying that the slowness was due to some code within the function itself.)
# line 76 of search_index.py
def not_operation(operand, dictionary, pfile):
    """Performs the operation `NOT operand`."""

    # A list of all the documents (sorted)
    all_docs = dictionary.all_docs()

    # A list of the documents matching `operand` (sorted)
    results = get_results(operand, dictionary, pfile, force_list=True)

    return [doc for doc in all_docs if doc not in results]
So it turns out that the list comprehension in the function was basically really
inefficient. It became super obvious once I narrowed down that not_operation
was slow.
Optimise/Fix ineffient code
Excited to have found a possible bottleneck, I quickly implemented a fix.
# the fix.
def not_operation(operand, dictionary, pfile):
    """Performs the operation `NOT operand`."""

    # A list of all the documents (sorted)
    all_docs = dictionary.all_docs()

    # A list of the documents matching `operand` (sorted)
    results = get_results(operand, dictionary, pfile, force_list=True)

    return list_a_and_not_list_b(all_docs, results)


def list_a_and_not_list_b(a, b):
    """Returns `a AND NOT b`.

    Both a and b are expected to be sorted lists.

    """
    results = []
    idx_a = 0
    idx_b = 0
    while idx_a < len(a) and idx_b < len(b):
        if a[idx_a] < b[idx_b]:
            results.append(a[idx_a])
            idx_a += 1
        elif b[idx_b] < a[idx_a]:
            idx_b += 1
        else:
            idx_a += 1
            idx_b += 1

    while idx_a < len(a):
        results.append(a[idx_a])
        idx_a += 1

    return results
Measure again
Measuring the time taken showed promising results. With this fix, the time taken dropped from roughly 1.5s to 1.15s.
time python search.py
# real    0m1.160s
# user    0m1.018s
# sys     0m0.133s
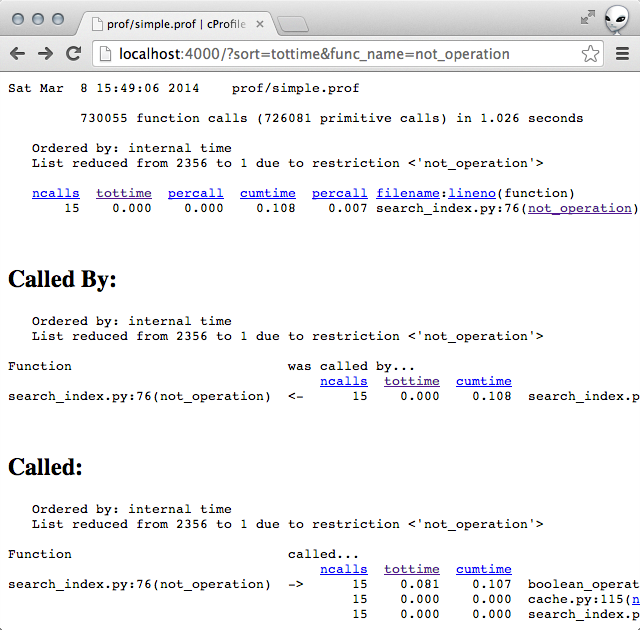
Profiling the code showed that the slowness was no longer coming from
not_operation.
Rinse and repeat
This time though, the most of the time seemed to be spent in the
list_a_and_not_list_b operation.
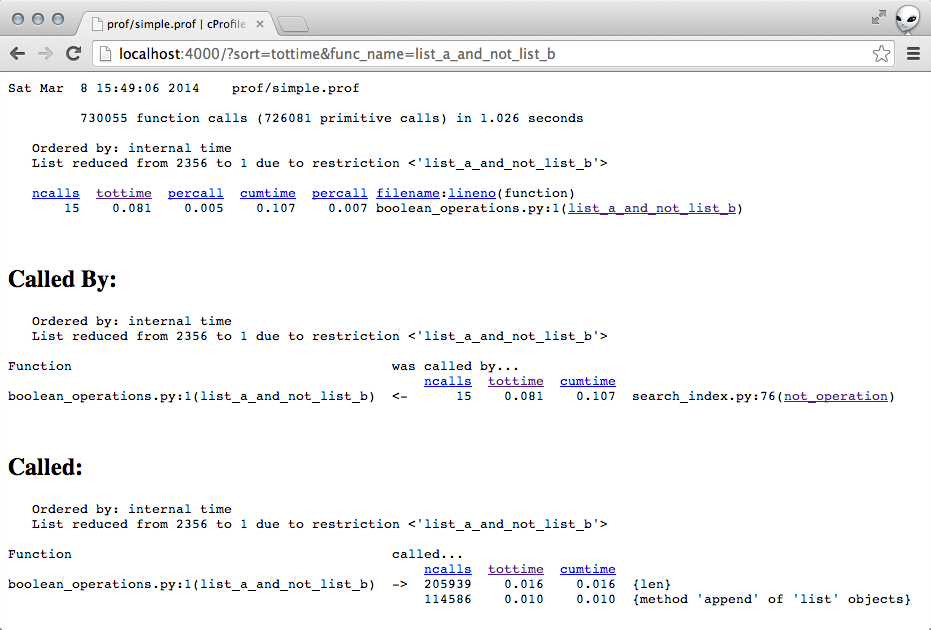
In particular, I seemed to be doing ~200k len operations and ~115 append
operations on some list objects.
This seemed like a red-flag so I took a closer look at the
list_a_and_not_list_b function.
It turns out that I really didn't need the while loop at the end of the function.
# From this.
while idx_a < len(a):
    results.append(a[idx_a])
    idx_a += 1

# To this.
results.extend(a[idx_a:])
Measuring with this new change:
time python search.py
# real    0m0.895s
# user    0m0.771s
# sys     0m0.122s
Woot! Got it to run under a second!
Summary
Overall, I'm pretty happy with the performance gain I got. I did a couple more that I didn't cover here (some other boolean operations were performing poorly under other testcases). Its a pretty cool feeling to methodically find bottlenecks and fix them.